Quality Buy/Sell Indicator with Scalping Mode + SL OnlyQuality Buy/Sell Indicator with Scalping Mode + SL Only is designed for traders who want clean and reliable signals for both swing and scalping strategies.
✅ Features:
Buy & Sell signals based on EMA and MACD logic
Scalping Mode (switch ON for faster, more frequent signals)
SL (Stop Loss) line displayed for every trade for easy risk management
Clean chart – no TP1, TP2, TP3 clutter
Option to show only the latest signal or the entire signal history
✅ How it works:
In normal mode you get fewer, more reliable signals – perfect for intraday or swing trading.
In scalping mode the indicator generates more signals for short-term trades (1–15m charts).
The Show All Signals switch allows you to keep the entire history visible, or only the latest trade setup for maximum clarity.
✅ Best suited for:
Traders who want clean charts without TP lines
Intraday and scalping traders looking for multiple setups per session
Swing traders who prefer clear Buy/Sell with risk control
Cari dalam skrip untuk "Buy sell"

Moving Average Buy/Sell IndicatorUsing a selected Exponential Moving Average (EMA)/Simple Moving Average (SMA) range, this indicator inserts a Long/Short (buy/sell) indicator overlaid on chart depending on the following conditions:
- LONG/BUY SIGNAL = if SMA value is less than EMA, and both the SMA and EMA are less than the current average price.
- SHORT/SELL SIGNAL = if SMA value is greater than EMA, and both the SMA and EMA are greater than the current average price.
**Intended for use with the 21 and 34 weekly moving average time range. Much more useful for long-term analysis rather than short-term analysis.**

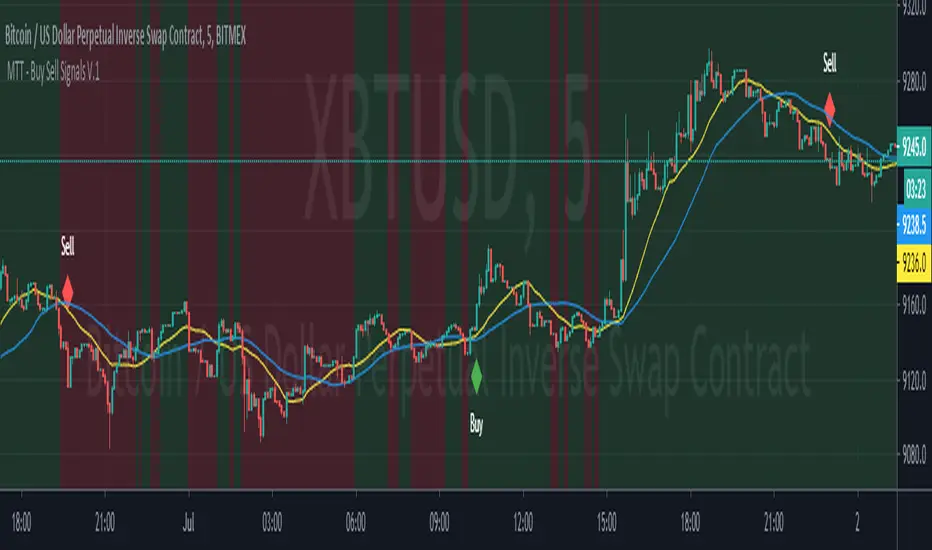
Market Trading Tools - Buy Sell SystemOur Buy Sell System indicator generally works on a modified version of the ATR ( Average True Range ) formula. The Buy Sell System is a trading method that generates Buy and Sell signals when conditions are met. These conditions include Exponential Moving Averages, ATR and depends on price action as well. Our indicator also shows a green/red background that indicates the trend on a chosen time frame.
** Our Indicator does not repaint.
** It can be used on any financial market; crypto, stocks or forex. We also encourage using time frames as the 15 minutes and above. The use of a higher than 4hr time frame requires special settings and once you have access to it, you can change the parameters as you want. We have enabled our users to freely use the settings as they wish and to their on discretionary.
Once you are granted access to use it, add it from going into the scripts >> invite only scripts >> enable the indicator. Once the indicator is added to your chart you will see the indicator popping up on your chart.
We are happy to announce that our trading indicator is special and unique from different ones because it firstly eliminates noise coming out from an average ATR indicator. We believe we are providing a service second to none and we are happy with our product.We believe that we have not seen a similar indicator, and we are proud of our work and we will continue updating the indicator when we believe it is necessary according to market changes. We have also enabled a function for our users to get a better view of the trend when they add the indicator to their chart. You can now view the trend background color (red&green) depending on if the price is above the EMA of your choice. you can also check whichever time interval you want that does not limit you to the time interval chosen on your chart itself.
Hope you enjoy it, Good luck and stay safe!
** If you are interested in this indicator. please use the link below to obtain access to this indicator
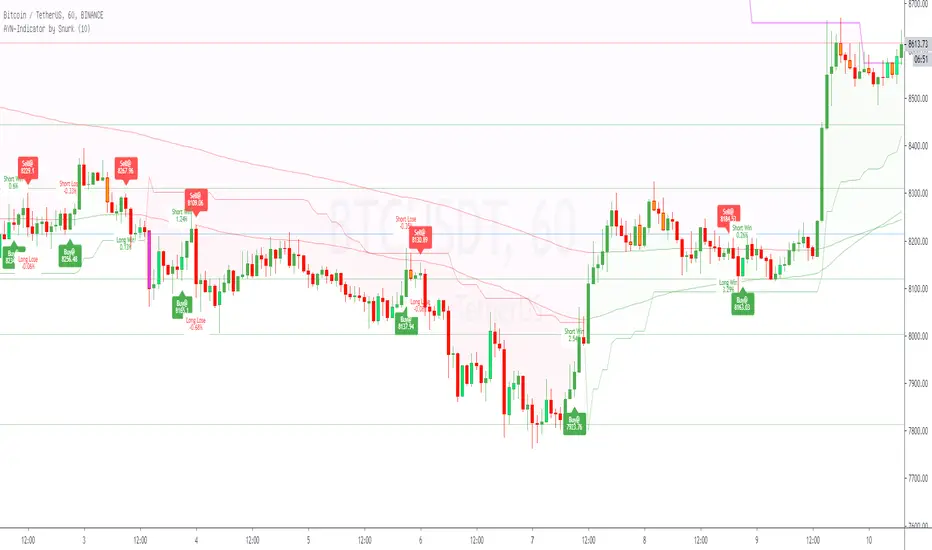
AYN: Buy-, Sell-, Trend- and SwingSignals incl. AutoFibo
Hi,
i want to introduce you to my AllYouNeed-Indicator. I calculate the buy sell signals within different timeframes independent in wich timeframe you are, therefore Pinescript suppose the Signal could be repainted. I was not able to fix this error, but after frequent checks of the result i haven't found a single repaint. Please try it out and let me know me, if you still get caught by a repaint.
Features:
- Short, Mid and Longterm-Trends
- Buy and Sell Signals and Results as well with Labels (Prices, Percentage, Win/Lose)
- Length Multiplier for different Marketsituations
- Trend-Signals with Barcolors (Lime=Uptrend, Fuchsia=Downtrend)
- Swing-Signals with Barcolors (Lime=Upswing, Orange=Downswing)
- Auto-Fibonacci with changing Linecolors as Support(green) / Resistance(red)
Hope you like it, feel free to contact me for further informations.
Please leave a comment on what I can do better, thanks.
Best regards,
snurk
MinhTarget Buy-Sell MinhTarget Buy-Sell has 2 option to buy-sell depends color of line or depends bar crosses with line ; so pls select on/off and see result.
Thank you!

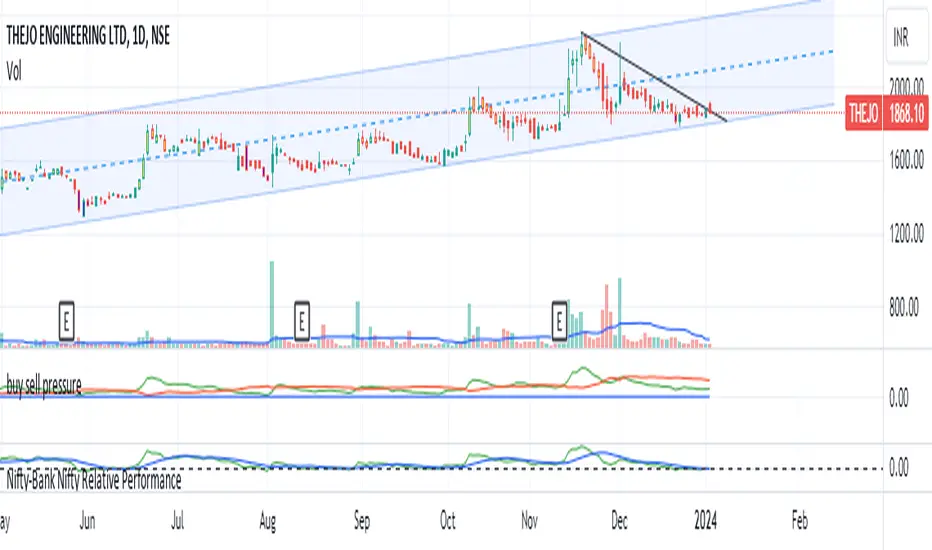
buy sell pressurebuy sell pressure indicator
Every stock /indices /chart is unique in nature. there will always be some kind of buyers and sellers present in these equities/stocks. due to their inherent buying and selling nature, these stocks also develop a pattern. such patterns are not always visible directly on the chart but we can calculate buying and selling pressure for these stocks individually . if we plot a graph on chart , we can easily see when stock is getting and when it is showing strength.
The logic for calculating buying and selling pressure is given below-
buying pressure= 14 days ema of {close- low(1)}
selling pressure= 14 days ema of {high(1)- close}
low (1) indicates 1 day ago candle's low price
high(1) indicates 1 day ago candle's high price
close= recent candle's close price
how to read chart :-
whenever buying pressure line (green color) crosses the selling pressure line (red color)stock will show strength and will go up. if the red line starts to cross the green line then we may see prices go down. so one can book profit here.
there is a unique zero line which is blue in color. it will act as a supreme buy and sell zone. if the green line touches or somehow goes below the zero line(blue line), stock will see strong buying pressure . if the red line (selling pressure line) goes below the zero line, the stock will witness strong selling pressure.
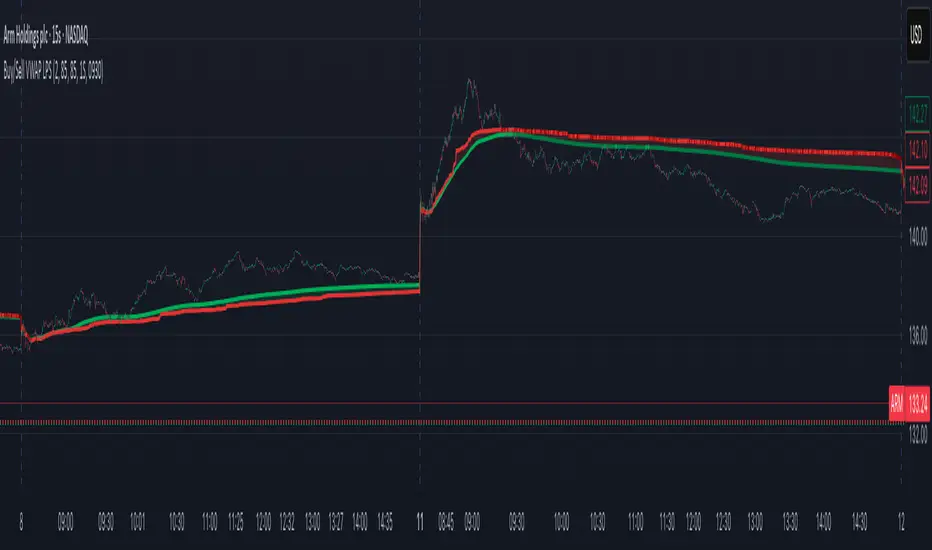
Buy/Sell Volume VWAP with Liquidity and Price SensitivityBuy/Sell Volume VWAP with Liquidity & Price Sensitivity
A dual-VWAP overlay that separates buy-side vs sell-side pressure using lower-timeframe volume and recent price behavior. It shows two adaptive VWAP lines and a bias cloud to make trend and imbalance easy to see—no params fussing required.
What you’ll see
Buy VWAP (green) and Sell VWAP (red) plotted on the chart
Slope-aware coloring : brighter when that side is improving, darker when easing
Bias cloud: green when Buy > Sell, red when Sell > Buy
Optional last-value bubbles on the price scale for quick readouts
How it works
Looks inside each bar (lower timeframe, e.g., 1-second) to estimate buy vs sell pressure
Blends that pressure with recent price movement to keep the lines responsive but stable
Maintains separate VWAP tracks for buy-side and sell-side and resets daily or at a time you choose
How to use it
Trend & bias: When Buy VWAP stays above Sell VWAP (green cloud), buyers have the upper hand; the opposite (red cloud) favors sellers.
Conviction: A wider gap between the two lines often means a stronger imbalance.
Context: Use alongside structure (higher highs/lows, key levels) for confirmation—this is not a stand-alone signal.
Inputs
Timeframe: Lower-TF sampling (default 1S).
Reset Time: Defaults to 09:30 (session open); set to your market.
Appearance: Two-shade palettes for buy/sell, line width, last-value bubbles, and cloud opacity.
Tips
Works on most symbols and intraday timeframes; lower-TF sampling can be heavier on resources.
If the cloud flips frequently, consider viewing on a slightly higher chart timeframe for cleaner structure.
Disclaimer
For educational use only. Not investment advice. Test on replay/paper before live decisions.
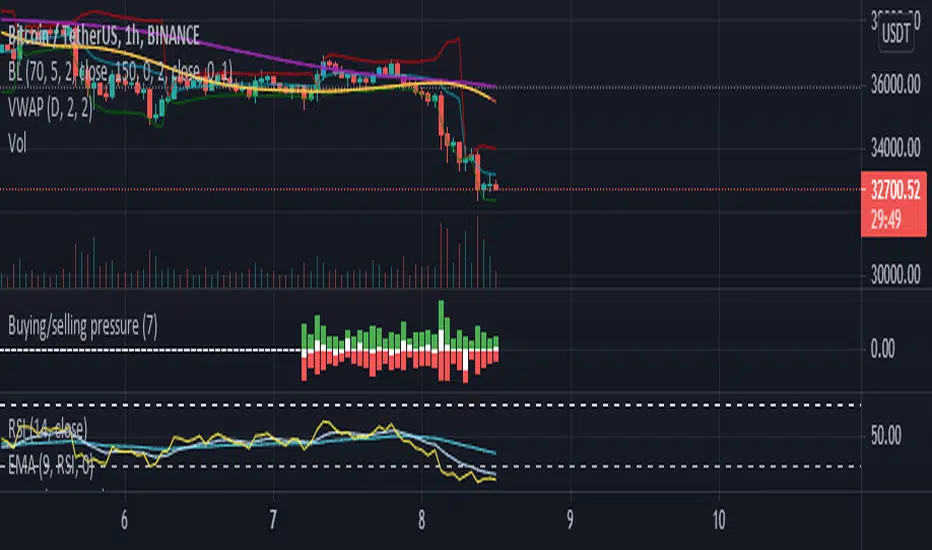
Buying/selling pressureBuying/selling pressure
Green bar for buying pressure, calculated by multiply Volume change and the increasing of price
Red bar for selling pressure, calculated by multiply Volume change and the decreasing of price
White bar is the subtract of Green bar and Red bar, which is calculated how strong of buying or selling in the market at the current timeframe.
The heigh of the Bars (green+red) is related to Moving average of Volume (100 points is equal to 100% of current Volume MA) , can set custom period in Setting.
Buy sell ATR Bollinger [vivekm8955]Buy Sell ATR Bollinger
This script combines Bollinger Bands with an optional ATR-based filter to generate high-probability Buy/Sell signals with trend confirmation.
🔹 Buy Signal: Price breaks above the upper Bollinger Band and trend flips bullish.
🔹 Sell Signal: Price drops below the lower Bollinger Band and trend flips bearish.
🔹 ATR Filter (Optional): Smoothens signals by filtering out weak breakouts based on volatility.
🔹 Visual Aids: Color-coded trend bands (Yellow for bullish, Red for bearish) with clean BUY/SELL labels.
🔹 Alerts Enabled: Get notified on signal generation.
✅ Suitable for intraday and swing traders
✅ Works across all timeframes
✅ Fully customizable inputs
trade safe with risk management! Happy trading!!

Buy/Sell EMA Trend Filter v6Buy/Sell EMA Trend Filter v6
This indicator provides a comprehensive trading system based on EMA crossovers with trend filtering for TradingView. It's designed to identify high-probability buy and sell signals by combining short-term crossovers with longer-term trend direction confirmation.
Key Features:
EMA Crossover System: Uses fast and slow EMAs (9 and 21 by default) to generate initial signals
Trend Filtering: Confirms signals with longer-term trend direction (50 and 200 EMAs)
Automatic TP/SL Calculation: Displays clear take profit and stop loss levels based on fixed risk points
Visual Alerts: Clear buy/sell markers at the point of signal with detailed labels
Risk Management: Pre-calculated risk-to-reward setup (default 1:2 ratio)
How It Works:
Buy Signal: When the fast EMA crosses above the slow EMA while the 50 EMA is above the 200 EMA (bullish trend)
Sell Signal: When the fast EMA crosses below the slow EMA while the 50 EMA is below the 200 EMA (bearish trend)
Customizable Parameters:
Fast EMA period (default: 9)
Slow EMA period (default: 21)
Trend EMA periods (default: 50 and 200)
Fixed risk in points (default: 20)
Reward ratio (default: 2.0)
The indicator displays clear entry points with predefined stop loss and take profit levels, making it ideal for traders looking for a systematic approach to the markets. Perfect for both day trading and swing trading timeframes.
This tool combines both trend following and momentum principles to filter out low-probability trades and focus on high-quality setups where the trend and momentum align.


Buy/Sell Position//Buy/Sell Position
//by Simple Trading Techniques
//The purpose of the buy/sell line is to decide when to buy
//or when to sell; taking the “guesswork” out of trading.
//Buy/Sell line is used to determine the overall trend of the market.
//It works on any timeframe, in any direction and in any market.
//BUY RULE
//Buy only when price (entry) is above the buy/sell line.
//SELL RULE
//Sell only when price (entry) is below the buy/sell line.

Buying/Selling PressureBuying/Selling Pressure - Volume-Based Market Sentiment
Buying/Selling Pressure identifies market dominance by separating volume into buying and selling components. The indicator uses Volume ATR normalization to create a universal pressure oscillator that works consistently across all markets and timeframes.
What is Buying/Selling Pressure?
This indicator answers a fundamental question: Are buyers or sellers in control? By analyzing how volume distributes within each bar, it calculates cumulative buying and selling pressure, then normalizes the result using Volume ATR for cross-market comparability.
Formula: × 100
Where Delta = Buying Volume - Selling Volume
Calculation Methods
Money Flow (Recommended):
Volume weighted by close position in bar range. Close near high = buying pressure, close near low = selling pressure.
Formula: / (high - low)
Simple Delta:
Basic approach where bullish bars = 100% buying, bearish bars = 100% selling.
Weighted Delta:
Volume weighted by body size relative to total range, focusing on candle strength.
Key Features
Volume ATR Normalization: Adapts to volume volatility for consistent readings across assets
Cumulative Delta: Tracks net buying/selling pressure over time (similar to OBV)
Signal Line: EMA smoothing for trend identification and crossover signals
Zero Line: Clear visual separation between buyer and seller dominance
Color-Coded Display: Green area = buyers control, red area = sellers control
Interpretation
Above Zero: Buyers dominating - cumulative buying pressure exceeds selling
Below Zero: Sellers dominating - cumulative selling pressure exceeds buying
Cross Signal Line: Momentum shift - pressure trend changing direction
Increasing Magnitude: Strengthening pressure in current direction
Decreasing Magnitude: Weakening pressure, potential reversal
Volume vs Pressure
High volume with low pressure indicates balanced battle between buyers and sellers. High pressure with high volume confirms strong directional conviction. This separation provides insights beyond traditional volume analysis.
Best Practices
Use with price action for confirmation
Divergences signal potential reversals (price makes new high/low but pressure doesn't)
Large volume with near-zero pressure = indecision, breakout preparation
Signal line crossovers provide momentum change signals
Extreme readings suggest potential exhaustion
Settings
Calculation Method: Choose Money Flow, Simple Delta, or Weighted Delta
EMA Length: Period for cumulative delta smoothing (default: 21)
Signal Line: Optional EMA of oscillator for crossover signals (default: 9)
Buying/Selling Pressure transforms volume analysis into actionable market sentiment, revealing whether buyers or sellers control price action beneath surface volatility.
This indicator is designed for educational and analytical purposes. Past performance does not guarantee future results. Always conduct thorough research and consider consulting with financial professionals before making investment decisions.

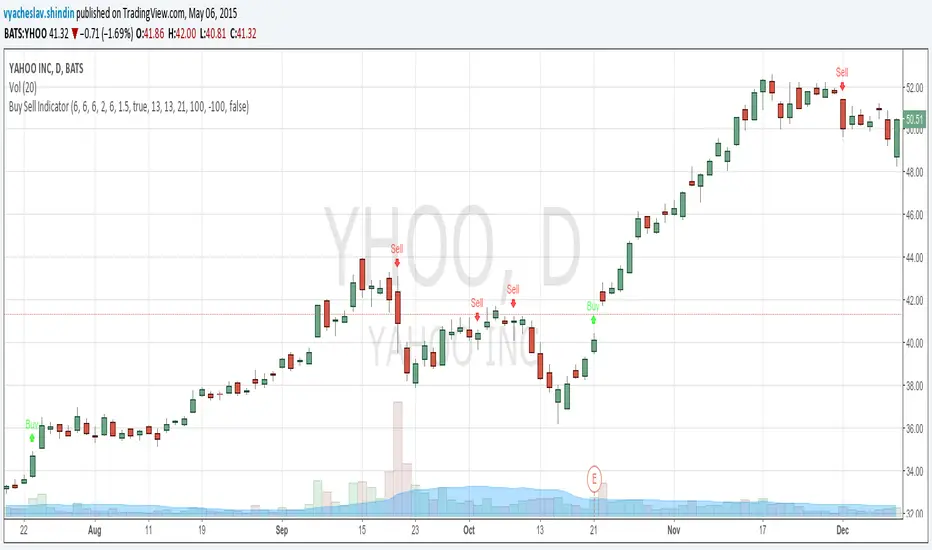
Buy/Sell IndicatorBuy/Sell Indicator
Overview
The Buy/Sell Indicator is designed to help traders identify potential entry and exit points in the market using a combination of Simple Moving Averages (SMA) and the Relative Strength Index (RSI). This indicator plots buy and sell signals directly on the chart, making it easier to make informed trading decisions.
Inputs
Fast MA Length: The period for the fast-moving average. Default is 9.
Slow MA Length: The period for the slow-moving average. Default is 21.
RSI Length: The period for the RSI calculation. Default is 14.
RSI Overbought Level: The RSI level considered overbought. Default is 70.
RSI Oversold Level: The RSI level considered oversold. Default is 30.
How It Works
Moving Averages:
The indicator calculates two SMAs: a fast-moving average (fastMA) and a slow-moving average (slowMA).
The fast MA reacts more quickly to price changes, while the slow MA reacts more slowly.
RSI:
The RSI is calculated to measure the momentum of price movements.
It helps identify overbought and oversold conditions in the market.
Buy and Sell Conditions:
Buy Signal: A buy signal is generated when the fast MA crosses above the slow MA and the RSI is below the overbought level.
Sell Signal: A sell signal is generated when the fast MA crosses below the slow MA and the RSI is above the oversold level.
Plotting
Buy Signals: Displayed as green labels below the bars where the buy condition is met.
Sell Signals: Displayed as red labels above the bars where the sell condition is met.
Moving Averages: The fast MA is plotted in blue, and the slow MA is plotted in orange.

Buy Sell Volume with delta value📄 Script Description
This indicator decomposes total traded volume into buying and selling volume, and displays their relative ratios.
🔎 Key Features
Buying vs. Selling Volume Separation
Uses the candle’s high, low, and close to split total volume into buying volume and selling volume.
Formula:
Buy = volume * (close - low) / (high - low)
Sell = volume * (high - close) / (high - low)
Volume Histogram Visualization
Plots overall volume (upper/lower) and separated buy/sell volumes as color-coded columns.
UPPER V / LOWER V: total volume
BUY V: buying volume (teal)
SELL V: selling volume (red)
Buy/Sell Ratio Calculation
Computes the percentage of buy and sell volume relative to total volume.
Buy Ratio = buyVolume / totalVolume * 100
Sell Ratio = sellVolume / totalVolume * 100
Ratio Display
Shows the latest Buy Ratio in a table (top-right corner of the chart).
Adds a label above the most recent bar displaying:
"Buy XX% / Sell YY%"
Historical ratios can be inspected through the TradingView Data Window or tooltip.
🛠️ Usage
Quickly identify whether volume during each candle is dominated by buyers or sellers.
Helps to assess market pressure and confirm potential trend direction, entries, or exits.
⚠️ Notes
Labels are shown only on the most recent bar (Pine cannot track mouse cursor events).
To see historical values, use the TradingView Data Window or hover tooltips.
This method provides an approximate split of volume and does not perfectly capture all market order flows.

Buy/Sell Volume Spike RadarThis indicator highlights unusual volume spikes and classifies them as buying pressure or selling pressure using price action context. It’s designed to spot when the crowd is stepping in aggressively — either on the bid (sell spikes) or on the ask (buy spikes).
How it works:
Compares current volume against a moving average of volume (default 50 bars).
A spike is flagged when volume is above the threshold (default = 2× vol MA).
Candle body position in its range determines direction:
Close near the top of the bar = Buy Spike.
Close near the bottom = Sell Spike.
Doji-like candles are filtered out using a minimum body % rule.
Visuals:
Background tint: teal for buy spikes, red for sell spikes.
Labels: optional tags on the chart showing “High BUY vol” or “High SELL vol”.
Histogram (lower pane): plots signed volume (positive = buy pressure, negative = sell pressure) with spikes emphasized.
Status table: shows live volume, moving average, and current spike status.
Use cases:
Spot institutional activity or panic selling.
Confirm breakouts or breakdowns with real buying/selling pressure.
Filter false moves by requiring both price + volume confirmation.
⚠️ Note: Options volume/flow data is not available in Pine/TradingView. This tool only analyzes the underlying’s price + volume. For true options flow, use a dedicated options analytics platform.

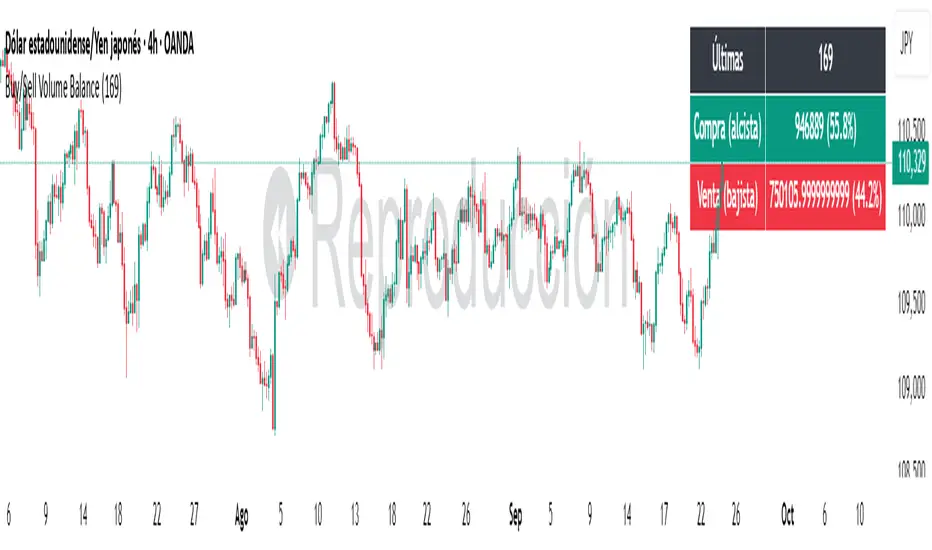
Buy/Sell Volume BalanceDESCRIPTION
Buy/Sell Volume Balance is a simple yet powerful indicator designed to measure and visualize the balance between buying and selling volume over a customizable number of recent candles. It helps traders quickly assess market pressure during consolidation phases or ranges, in order to anticipate the most likely breakout direction.
How it works
The indicator analyzes the last N candles (default = 100, user-editable).
Each candle’s total volume is classified as:
Bullish volume (Buy volume): if the candle closes above or equal to its open.
Bearish volume (Sell volume): if the candle closes below its open.
The volumes are summed separately to calculate:
Total Buy Volume
Total Sell Volume
The percentage of each side relative to the total is also displayed.
All results are shown in a fixed table at the top of the chart for quick interpretation.
Purpose
This tool is specifically designed to help traders evaluate the internal battle between buyers and sellers during a range or sideways market. By understanding which side is accumulating more volume within the range, traders can anticipate which direction is more likely when the price breaks out.
If Buy volume dominates → potential bullish breakout.
If Sell volume dominates → potential bearish breakout.
If both sides are nearly balanced, it signals indecision and a higher chance of false breakouts.
Imbalance Threshold
In practice, traders often consider a clear imbalance when one side reaches at least 55–60% of the total volume.
Above this threshold, the dominant side is more likely to dictate the breakout direction.
Below this threshold, the market is usually in indecision and further confirmation is needed before acting.
How to use it
Add the indicator to your chart and choose the lookback period (number of candles).
Focus on ranges or consolidation zones where price is moving sideways.
Observe the balance of Buy vs Sell volume in the top-right box:
A clear imbalance (>55–60%) suggests the stronger side is more likely to push the breakout.
A balanced ratio (<55–60%) indicates indecision and possible false breakouts.
Use it in combination with support/resistance zones, breakout patterns, or volume spikes for best results.
✅ In summary: This indicator does not give direct buy/sell signals, but it provides valuable context about market pressure, helping you to align your trades with the most probable breakout direction.
Buy/Sell Volume Bubbles on Candles🎯 New Big Order Filter Features:
Volume Filter Settings (New Group):
Enable Big Order Filter (Default: ON)
Toggle to show only significant volume
When OFF, shows all bubbles
Volume Threshold (Default: 1.5x)
Overall volume must exceed average by this multiple
1.5 = 150% of average (only big volume candles)
Range: 0.5x to 5.0x
Min Buy Volume Threshold (Default: 1.2x)
Buy volume must exceed average buy volume
1.2 = 120% of normal buying
Filters out small buy orders
Min Sell Volume Threshold (Default: 1.2x)
Sell volume must exceed average sell volume
1.2 = 120% of normal selling
Filters out small sell ordersPractical Examples:
Conservative (Show fewer, bigger orders):
Volume Threshold: 2.0x (only double-average volume)
Buy/Sell Threshold: 1.5x (only strong buying/selling)
Result: Very clean chart, institutional-sized orders only
Moderate (Default - Good balance):
Volume Threshold: 1.5x
Buy/Sell Threshold: 1.2x
Result: Shows significant orders, filters noise
Aggressive (Show more activity):
Volume Threshold: 1.0x
Buy/Sell Threshold: 0.8x
Result: More bubbles, captures medium orders
Use Cases:
🐋 Whale Watching (Set 2.5x+):
Only massive institutional orders
Spot market makers and big players
📊 Swing Trading (Set 1.5x):
Significant volume clusters
Key support/resistance confirmation
⚡ Active Trading (Set 1.2x):
More frequent signals
Better order flow visibility
Chart Clarity:
✅ No more bubble clutter
✅ Focus on significant orders
✅ Easy to spot institutional activity
✅ Independent buy/sell filtering

buy sell ultra systemWhat it is
EMA-POC Momentum System Ultra combines a proven trend stack (EMA 20/50/238), a price-of-control layer (POC via Bar-POC or VWAP alternative), and a momentum trigger (RSI) to surface higher-quality entries only when multiple, independent conditions align. This is not a cosmetic mashup; each component gates the others.
How components work together
Trend (EMA 20/50/238): Defines short/medium/long bias and filters counter-trend signals.
POC (Bar-POC or Alt-POC/VWAP): Locates the most-traded/weighted price area; a neutral band around POC helps avoid chop.
Control background: Above POC → buyers likely in control; below → sellers.
Momentum (RSI): Entry arrows print only when RSI confirms with trend and price location vs POC; optional “cross 50” requirement reduces noise.
Optional HTF trend: Confluence with a higher-timeframe EMA stack for stricter filtering.
Why it’s original/useful
Signals require confluence of (1) EMA trend stack, (2) POC location and neutral-zone filtering, (3) momentum confirmation, (4) optional slope and distance-to-POC checks, and (5) optional HTF trend. This reduces false positives compared with using any layer in isolation.
How to use
Markets/TFs: Built for XAUUSD (Gold) and US30. Works 1m–1h for intraday; 2h–4h for swing.
Entries:
Long: EMA stack bullish, price above POC, not in neutral band, RSI condition true → “Buy” arrow.
Short: Opposite conditions → “Sell” arrow.
Stops/Targets (suggested):
Initial stop beyond POC/neutral band or recent swing.
First target around 1R; trail with EMA20/50 or structure breaks.
Settings to tune:
POC Mode: Bar-POC (highest-volume bar’s close over lookback) or Alt-POC (VWAP).
Neutral Band %: 0.10–0.35 typical intraday.
Min distance from POC: 0.10–0.50% helps avoid low-RR entries right at POC.
RSI: Choose “cross 50” for stricter triggers or simple >/< 50 for more signals.
HTF trend: Turn on for extra confluence.
Alerts:
Buy Signal and Sell Signal (separate), or one Combined Buy/Sell alert.
Set to “Once per bar close” if you want only confirmed arrows.
Repainting / limitations
Shapes can move until bar close (standard Pine behavior) when using intrabar conditions; final confirmation at close. No system guarantees profitability—forward test and adapt to your market/instrument.
Clean chart
The published chart contains only this script so outputs are easy to identify.
Versions / updates
Use Publish → Update for minor changes; do not create new publications for small tweaks. If you fork to preserve older behavior, explain why and how your fork differs.
Changelog
v1.1 – Tuning for Gold/US30, neutral-band & distance filters, optional HTF trend, combined alert.
v1.0 – Initial public release (EMA stack + POC modes + RSI + alerts).
License & credits
Open-source for learning and improvement. Please credit on forks and explain modifications in your description.

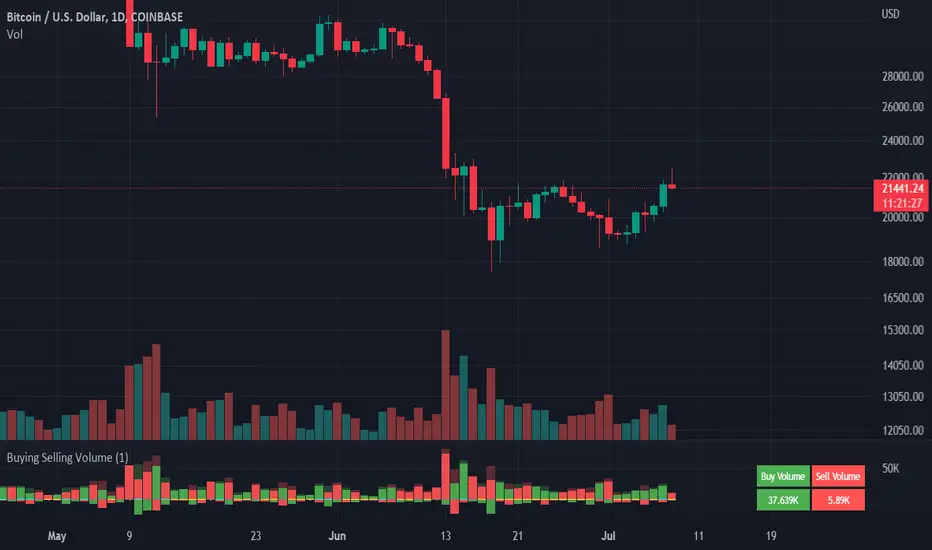
Buying Selling Volume v3Bug fixed from v2. Currently adds up values correctly.
Note: To get more accurate readings reduce the time frame. For some reason it isn't counting the last bar and I am not smart enough to figure out why.
Builds on Ceyhun's "Buying Selling Volume" indicator. This version allows users to define periods by effortlessly dragging two points or you may define periods by manually entering the start and end times in the settings window. Once the period is defined, both buying and selling volume will be totaled thus displaying the amount of buys and sells in that period.
I have found the information provided from the script helps in defining a period of consolidation as either being accumulative or distributive.